In a previous blog post, we looked at the difference between KPIs and KRIs. So what’s the best way to come up with some Key Risk Indicators (KRIs) for your business? We have some tips.
The obvious data isn’t the best data
Start by asking: “What needs measuring, and why?” rather than: “What data is available?” Some of the best indicators may have the least amount of data readily available.
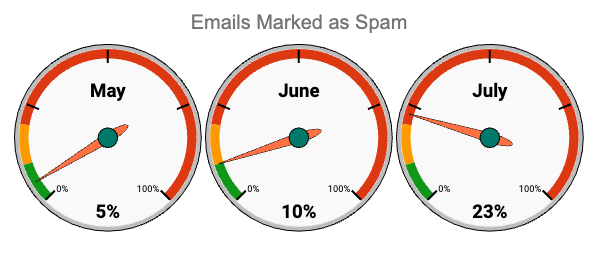
Key Risk Indicators (KRIs) in cyber security especially can be quite technical, focusing on something easy to measure because associated tooling is spitting out a precise measurement e.g. number of spam emails received. Good KRIs can be linked to a more macro-level business objective. Continuing the example: why are we so concerned about spam emails anyway? What overall business objective is this measurement related to?
Just as Key Performance Indicators (KPIs) can help track and measure past and present progress towards objectives, KRIs can act as early warning systems, telling you about obstacles that might prevent you achieving the same business objective.
The best test for any good KRI is to look at it and ask yourself:
“So what?”
What does this tell me that I didn’t know before about achieving my business objective? How well is it helping me understand a risky business activity or process and hence make better decisions? Is there a better KRI out there that will be more meaningful or representative?
A spam filter’s dashboard will probably tell you how many spam emails it caught in the last month, but what it is really doing is telling you about past performance.
“Aren’t I a good spam filter? You should probably renew my licence now!”
Is that really a good measure of future risk? The number might go up next month, but that doesn’t necessarily mean the business is at increased risk, it could just be that the spam filter was more effective. Would it not be better to also measure the percentage of total emails that were marked as spam?

As per the example here, you should also look to make it as easy as possible to answer that question of ‘So what?’. You wouldn’t necessarily expect your CIO to know what is an acceptable level of spam, so use visual indicators (shown here as green, ambert and red bars around the dial) or even just a sentence or two that provides sufficient context such that they can take action when needed.
Tie KRIs to business objectives
Even if you take the time to choose the right indicator, there are many things you could measure and you’ve probably only got space on that dashboard for a handful of macro KRIs, so let’s focus on what is really important to the business.
If the business:
- holds a lot of personal data, then focus more on metrics around how that is protected;
- needs high availability, then ensure sufficient metrics are presented on that;
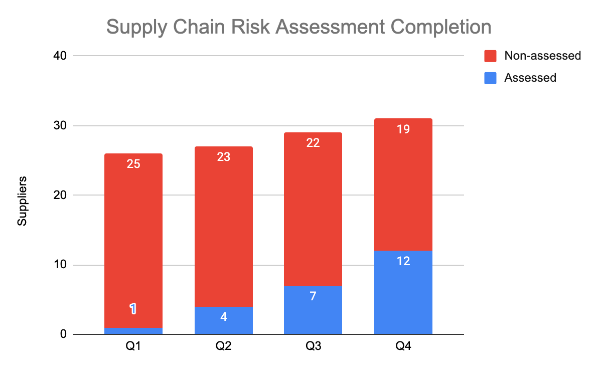
- depends on a supply chain (e.g. in manufacturing), then metrics need to focus on something like how many suppliers have been risk assessed in the last 12 months.
Start collecting!
Both KPIs and KRIs work best when you can provide both the current week/month/quarter and previous periods (as a graph), so leaders can track changes, trends, and patterns over time.

This isn’t always available at the start when new metrics are introduced, but KPIs can work ‘out of the box’ when compared against a pre-agreed target which helps them become a trailing edge indicator of previous performance. With KRIs you can start immediate comparisons with external industry data that will help provide context as leading edge indicators of risk in the longer term.
Don’t just focus on technology
It can be very easy to focus on metrics around technology. Computers are built on the concept of mathematical operations and so unsurprisingly are very good at spitting out numbers! Vendors will also often focus on metrics from their platforms that report on the performance of their product.
But remember: many successful cyber attacks will rely on a compromise of people (phishing) or process (time taken to respond to an incident), and so KRIs should have coverage across people, process and technology.