In our previous blog post, we talked about risk scenarios and how they can help us better understand risk. Now let’s talk about the transition between qualitative and quantitative risk management.
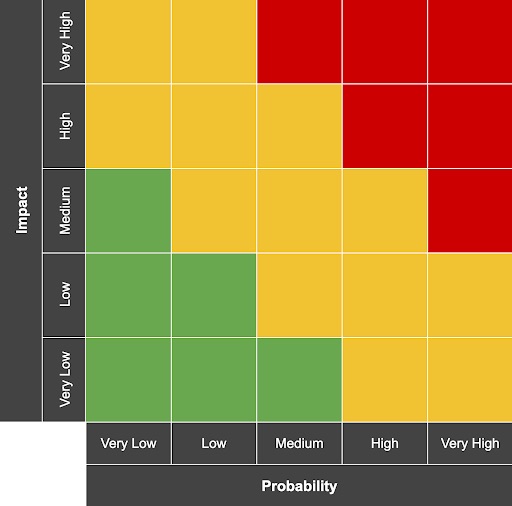
When implementing a quantitative approach into your strategy, you may not be starting from scratch. You may already be tracking and communicating risk priority using a qualitative Probability Impact Graph, or PIG for short.
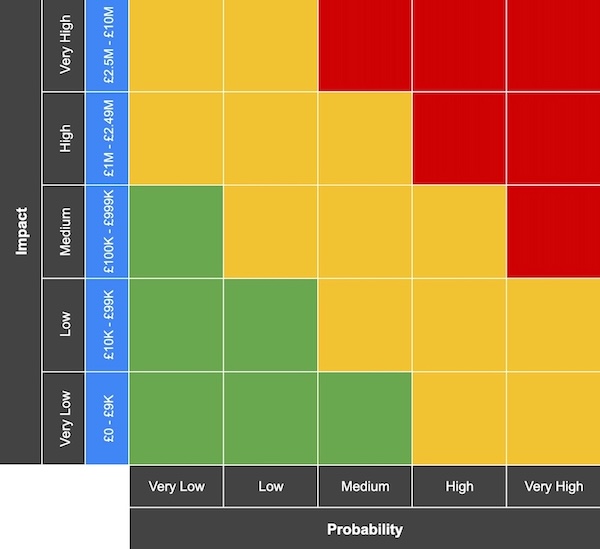
You’ve probably seen a PIG before. It looks a little bit like this:
Here at Cydea, we are not big fans of PIGs, because they often create more problems than they solve. Robin covered this, as well as the benefits of a quantitative approach, in greater detail in his blog post - Communicating risk.
If you would like to move towards more quantitative methods to track and communicate risk, read on for some guidance on how you can get started.
Where to begin
Transitioning from this kind of risk assessment to a quantitative method can seem daunting at first – nobody wants to undo their hard work and start again. Thankfully, the process needn’t be as painful as it may seem.
Start off small and work with a single risk scenario which has already been analysed and recorded. For example: the risk of a researcher publishing a critical vulnerability in a software component used by our organisation, resulting in business disruption.
Start with the risk’s probability
Look back at your existing PIG. Revisit the basis on which the risk’s current probability rating was chosen to ensure that it is up-to-date.
Often, this rating is chosen in accordance with a specified range, e.g. “Low = 10% - 25%”. If this is the case, it’s now time to narrow the range down to a single yearly figure.
This is important, as it allows you to further refine probability through the use of quantitative calculations and simulations.
Use all relevant information you have for the risk and consider including additional internal (e.g. previous incidents and near misses) and external (e.g. breach reports) data sources to ensure an accurate probability assessment.
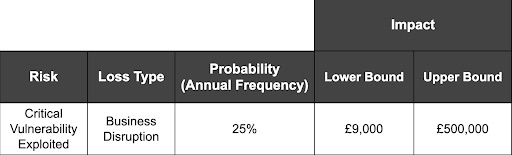
For our example risk, the probability will be once every four years, or 25% per year on average.
Move on to the risk’s impact
Now we’ll consider the vertical axis of the PIG. Look at the risk’s current impact rating and convert it to a monetary value, measured in your local currency.
It may seem hard to be specific, but you can use any information that led to the risk’s current impact rating, such as stakeholder input and cyber insurance reports, to estimate the lower and upper bounds of the event’s impact on your organisation.
The key here is to be confident that, nine times out of ten, if the risk were to materialise, the impact would fall somewhere between these two bounds.
Our blog post, Why is estimating an important skill? may help with this. It includes more detail on the 90% confidence interval.
For our example risk, we estimate that nine times out of ten, the unplanned costs resulting from this risk will have a lower bound impact of £9,000, and an upper bound impact of £500,000. This represents a few days of minor disruption at the lower bound, all the way through to significant exploitation and disruption over several weeks at the upper bound.
The quantitative approach puts risks in perspective
Put all this into a simple table, and the results look more like this:
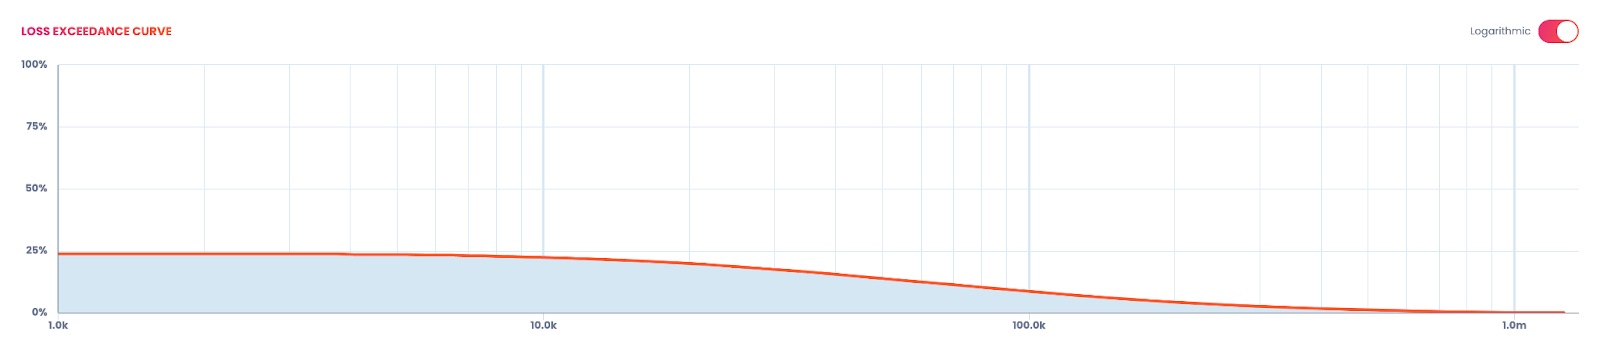
At this point, you have a better understanding of this specific risk, and could use it in a quantitative risk assessment tool to produce some useful information. Here is an example from Cydea’s Risk Platform:
You can now repeat this for other risks or, if time is limited, you can begin by applying the same process to define ranges for all of the impact ratings in your matrix. Your PIG will start to look a bit different:
This is a quick way to provide greater context on all of your current risks, though unfortunately some problems remain. The PIG is still ambiguous, and fails to fully demonstrate the value you’ll gain from implemented controls. That failure will make it harder for you to effectively prioritise risks.
Moving further towards risk quantification and leaving the PIGs behind solves these issues and enables you to view and communicate risk more clearly.
It’s a start
This simple starting point sets you on the path of using quantitative risk assessment methods instead of qualitative ones.
If you would like to further quantify your risks check out our series, The Maths Explained, which covers some of the more complex calculations that go into the process, and consider using a dedicated tool to make the task easier.
If this all sounds too complicated, or you just don’t have the time, there are lots of ways Cydea can help you assess and manage your cyber risk, so please get in touch.
In our next blog post, we’ll be covering how to define your organisation’s Risk Tolerance by engaging with the wider business.